Technical Analysis Cryptocurrency: Unraveling the Beginner's Guide
Discover how to use technical analysis cryptocurrency to trade like a pro, even if you're a beginner. This guide will teach you everything you need, from chart patterns to indicators to risk management.
 |
| Technical Analysis Cryptocurrency- A Beginner's Guide |
Hey there, fellow crypto enthusiast! Ready to dive into the exciting world of technical analysis for cryptocurrency trading? Well, you're in for a treat. We're about to break down the nitty-gritty of this powerful tool that can help you navigate the crypto market with style.
What is Technical Analysis, Anyway?
So, first things first, let's demystify this jargon. Technical analysis is like the Sherlock Holmes of crypto trading. It's all about scrutinizing historical price charts, patterns, and indicators to predict future price movements. Sounds cool.
Why Bother with Technical Analysis in Crypto Trading?
Glad you asked! Imagine being able to make informed decisions about when to buy or sell your precious digital coins. Technical analysis provides valuable insights, like when it's time to HODL or when it's time to cash out. It's like having a crystal ball for the crypto market.
Types of Technical Analysis - We've Got Options
There's more than one way to crack this crypto code. Here are a few popular methods:
1. Candlestick Patterns: These little guys resemble candles and reveal essential price movements.
2. Moving Averages: Consider them your trend-spotting buddies, helping you see the bigger picture.
3. RSI (Relative Strength Index): Like the beating heart of a cryptocurrency, it gauges the pace and variation of price fluctuations.
How to Get Started with Technical Analysis
Ready to roll up your sleeves and get into the action? Here's a step-by-step guide to kickstart your technical analysis journey:
Step 1 - Gather Your Tools: You'll need access to historical price charts and indicators. Websites and trading platforms like TradingView and CoinMarketCap can be your best friends.
Step 2 - Learn the Basics: Understanding candlestick patterns, support and resistance, and trendlines is crucial. These are your building blocks.
Step 3 - Practice, Practice, Practice: Start with a demo account or paper trading to hone your skills. Remember, Rome wasn't built in a day!
Step 4 - Keep Learning: The cryptocurrency industry is constantly changing. Keep up with the most recent news and fashions.
Basic Technical Analysis Indicators
Let's talk shop about some key indicators that you'll encounter in your technical analysis journey:
1. Moving Average (MA): It's like a smooth operator, helping you spot trends and potential reversals.
2. Relative Strength Index (RSI): This one tells you if a cryptocurrency is overbought or oversold, giving you a heads-up on potential price swings.
3. MACD (Moving Average Convergence Divergence): It's a mouthful but helps you identify changes in a crypto's momentum.
So there you have it, a beginner's guide to technical analysis in cryptocurrency. Armed with these insights, you're ready to confidently tackle the crypto market. Happy trading, and may your gains be ever in your favor!
Cracking the Code: Basic Technical Analysis Indicators
Imagine you're on a treasure hunt; these indicators are your trusty map. They help you navigate the volatile waters of cryptocurrency trading. Let's break them down, one by one, with some flair:
Moving Averages: Ride the Crypto Waves
Picture this: Moving averages are like surfboards in the crypto ocean. They smooth out the waves (price fluctuations) and help you catch the trend. Here's how they work:
Simple Moving Average (SMA): A gentle wave represents the average price over a specific period. It keeps you grounded when prices get choppy.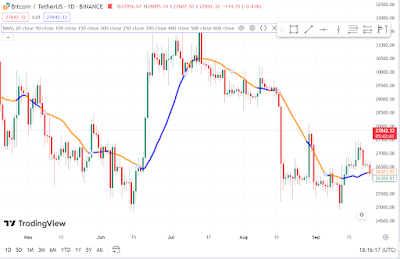 |
| Simple Moving Average (SMA) |
 |
| Exponential Moving Average (EMA) |
You wouldn't go hiking without a fitness tracker, right? RSI is your cryptocurrency fitness tracker. It gauges the Force and swiftness of price changes. It could be time for a break if it's higher than 70. It's like unearthing a secret gem if it's under 30.
 |
| Relative Strength Index (RSI) |
Imagine Bollinger Bands as a tasty sandwich. The middle layer is the SMA (Simple Moving Average), and the outer layers are the price volatility. When the bands squeeze together, it's like a delicious double-decker waiting for a breakout.
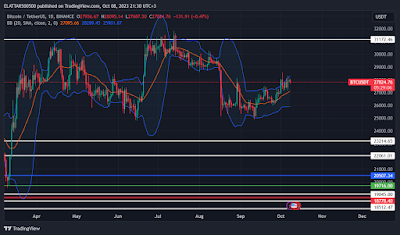 |
| Bollinger Bands: Crypto's Delicious Double-Decker |
MACD is like the gears of a crypto engine. It displays how two moving averages relate to one another, assisting you in identifying trends and potential buy/sell opportunities. Think of it as the engine roaring to life.
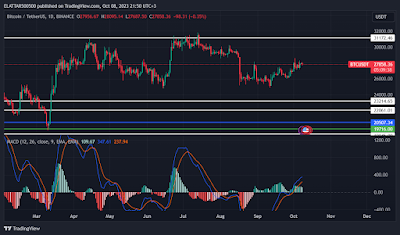 |
| MACD (Moving Average Convergence Divergence): Crypto's Gears |
Picture the Stochastic RSI as a pendulum. It swings between 0 and 100, revealing overbought and oversold conditions. It's like knowing when the pendulum is at its peak, ready for a swing in the other direction.
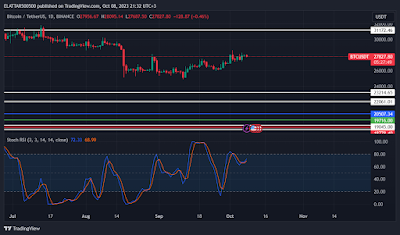 |
| Stochastic RSI: The Crypto Oscillator |
Chart Patterns: The Crypto Mysteries Unveiled
Think of chart patterns as clues left behind by the crypto market. They tell a story, and your job is to decipher it. Let's unravel these patterns one by one, with a dash of creativity:
Head and Shoulders: The Sherlock of Patterns
Imagine a chart wearing a Sherlock Holmes hat, and you've got the Head and Shoulders pattern. It's like a detective's hunch that a trend reversal is afoot. Here's how it works:
Head: The highest peak in the middle, like a suspect's confession.Shoulders: Two smaller peaks on either side, resembling a crooked smile.
Double Top and Double Bottom: The Plot Twisters
These patterns are like plot twists in a crypto thriller.
Double Top: It's a bearish omen, signaling a potential price drop. It looks like two mountain peaks; when the second one is lower, it's a red flag.Double Bottom: This one's a bullish surprise. It's like finding hidden treasure. Two lows, but the second one is higher, indicating a possible trend reversal.
Wedges and Triangles: The Crypto Geometric Puzzles
Wedges and triangles are the geometric puzzles of the crypto world.
Wedges: They show tightening price ranges, like a coiled spring ready to bounce. It can be ascending (bullish) or descending (bearish).Triangles: Think of these as price battles between bulls and bears. Symmetrical triangles are like a tug-of-war while ascending and descending triangles show which side is winning.
Flags and Pennants: The Crypto Pirates
Flags and pennants are like the Jolly Roger flags of the crypto market.
Flags: These are rectangular patterns, like a flag fluttering in the wind. They signal a continuation of the current trend.Pennants: Picture these as small triangles, like a ship's pennant. They also suggest a continuation of the trend but with a brief consolidation.
Channels: The Crypto River
Channels are like rivers guiding the price. They can be ascending (bullish), descending (bearish), or horizontal (sideways). It's like knowing the flow of the crypto current.
Identifying Trends: The Market's Roadmap
Imagine trends as the roadmaps of the trading world. They tell you where the market is headed. Technical analysis helps you spot them like a pro, whether a bullish uptrend or a bearish downtrend.
Determining Support and Resistance: Building Your Trading Foundation
Support and resistance levels are like the pillars of a building. They hold everything up. By analyzing past price movements, technical analysis helps you identify these crucial levels, giving you a solid foundation for your trades.
Finding Entry and Exit Points: Your Trading Doorways
Entry and exit points are like doors in a maze. You need to know when to enter (buy) and when to exit (sell). Technical analysis provides the keys to these doors, helping you make timely and profitable decisions.
Managing Risk: Your Trading Safety Net
Risk management is your safety net in the trading circus. Technical analysis can help you set stop-loss orders, determine position sizes, and reduce the risks associated with your trades. It's like having a safety harness while tightrope walking.
Putting It Into Practice
Now that you are familiar with the fundamentals, let's discuss how to use technical analysis:
Start with a Plan: Every successful trader needs a trading plan. Define your goals, risk tolerance, and strategies.Chart Analysis: Dive into historical price charts and start identifying trends, support, resistance levels, and potential entry and exit points.
Indicators and Tools: Technical analysis offers a range of indicators and tools. Experiment with moving averages, RSI, MACD, and more to refine your trading decisions.
Practice Makes Perfect: Like any skill, practice makes perfect. Consider using demo accounts to hone your skills without risking real money.
The Journey Begins
Congratulations! You've just taken your first step into the fascinating world of using technical analysis for trading decisions. With dedication and practice, you'll make more competent trades and navigate the trading landscape like a seasoned pro.
Remember, the trading world is an adventure filled with ups and downs. With technical analysis as your ally, you're well-equipped to face the challenges and reap the rewards of the trading game. So, go forth and trade wisely
Why It's Key to Do Your Own Crypto Homework
Before you jump into the wild world of crypto investing, remember this golden rule: Do Your Own Research (DYOR). Here's why:
- Understanding the Crypto Game: To play, you gotta know the rules. DYOR means grasping the tech, the team behind it, its purpose, and the community vibe.
- Risky Business: Crypto ain't your grandma's savings account. It's wild and wacky, and prices can rollercoaster. You gotta be aware of the risks.
Tech Analysis Tips for Smart Investing
Now, if you're eyeing those charts and numbers, keep these tips in your toolkit:
- Diversify Your Indicators: No one indicator's the oracle. Combine 'em for a clearer picture.
- Timing Matters: Tech analysis shines in some market conditions but flops in others. It's like using an umbrella in a hurricane, not smart.
- No Crystal Balls: Tech analysis isn't fortune-telling. It's about spotting opportunities, not guarantees.
Crypto Success Stories
Check out these real-life tales where tech analysis saved the day:
- Trader's Delight: Used tech indicators, hopped on Bitcoin at $30K and bailed at $40K. Result? A sweet 33% profit.
- Ethereum Escape: Tech magic signaled an exit at $1,750 for Ethereum, saving a 25% loss on a trade entered at $2K.
- Litecoin Lift-off: Tech analysis was the ticket for a short trade on Litecoin. Entry at $50, exit at $40, and a 20% profit.
Tech Analysis Lingo
Decode the jargon:
Support Level: The floor price.Resistance Level: The price ceiling.
Trendline: Connects price dots, revealing the trend's path.
Moving Average: The price average over time.
MACD: Measures driving average dynamics.
RSI: Gauges crypto strength.
Disclaimer and Legal Stuff
This info is for learning, not wallet-padding. Always do your own homework before taking the crypto plunge.
Wrap-Up
Tech analysis is an excellent tool, but it could be much better. Mix it with other smarts like fundamental analysis. And remember:
- Start simple; stay moderate with indicators.
- Practice on paper before diving into actual trades.
- Patience, young grasshopper. It takes time to master this crypto game.
Now you're ready to tackle the crypto jungle!
FAQ – Technical Analysis Cryptocurrency- A Beginner's Guide
Q1: How do you know when crypto will rise or fall?
Predicting the exact movements in prices is tricky, so here is where the technical analysis comes into the picture, taking into account historical data of prices and volumes, using indicators to identify patterns that help in making any kind of educated guessing. However, this is not full-proof and does not guarantee results in the future.
Q2: What is the most accurate crypto indicator?
There are no right answers. There are facilities used in preference by different traders. Moving Averages and MACD are the most popular. The difference will lie in how correct they are based on how correct the trader implements and understands them.
Q3: What is the best technical analysis for crypto?
Others may be the best way of technical analysis for different traders. Candlestick patterns, chart patterns, triangles, head and shoulder, indicators—these are always included. Again, a function of what really works for you is based on your personal trading style and strategy.
Q4: How do I learn crypto technical analysis?
Learning technical analysis involves studying chart pattern indicators and practicing. You can find numerous online resources, courses, and books on the subject. Start with the fundamentals and steadily expand your understanding through practice and observation.
Q5: Does technical analysis work on cryptocurrency?
Technical analysis can be practical for crypto but is not a guaranteed predictor. Crypto markets can be highly volatile and influenced by various factors, including news and sentiment. It is a tool that aids in decision-making, but it cannot ensure success.
External sources- Technical Analysis Cryptocurrency- A Beginner's Guide
1. CoinDesk's Technical Analysis HubCoinDesk Technical Analysis
2. MoneyControl's Bitcoin Breakdown
MoneyControl Bitcoin Analysis
3. OANDA's Trading Wisdom
OANDA Crypto Technical Analysis
4. Cointelegraph's Chart Mastery
CoinTelegraph Crypto Charts
5. Investopedia's Chart School
Investopedia Crypto Charts
Internal sources- Technical Analysis Cryptocurrency- A Beginner's Guide
How to Buy Cryptocurrency: A Starter's HandbookHow to Buy Cryptocurrency: A Starter's Handbook
Cryptocurrency Investing: A Deep Dive
Cryptocurrency Investing: A Deep Dive
Top Crypto Exchanges Compared
Top Crypto Exchanges Compared
Cryptocurrency Mining: The Basics
Cryptocurrency Mining: The Basics.
Smart Contracts Unraveled
Smart Contracts Unraveled
%20(2).png)